WHY SELF STORAGE
Three Reasons to Invest
28 Year Average Annual Returns of 18.83%
According to the NAREIT* the self storage asset class has achieved an average annual return of 18.83% over the past 28 years. Self Storage has outperformed Apartments (14.21%), Free Standing Retail (13.53%), Office (12.10%), and the S&P 500 (8.4%) over that same time period.
Downsize Protection
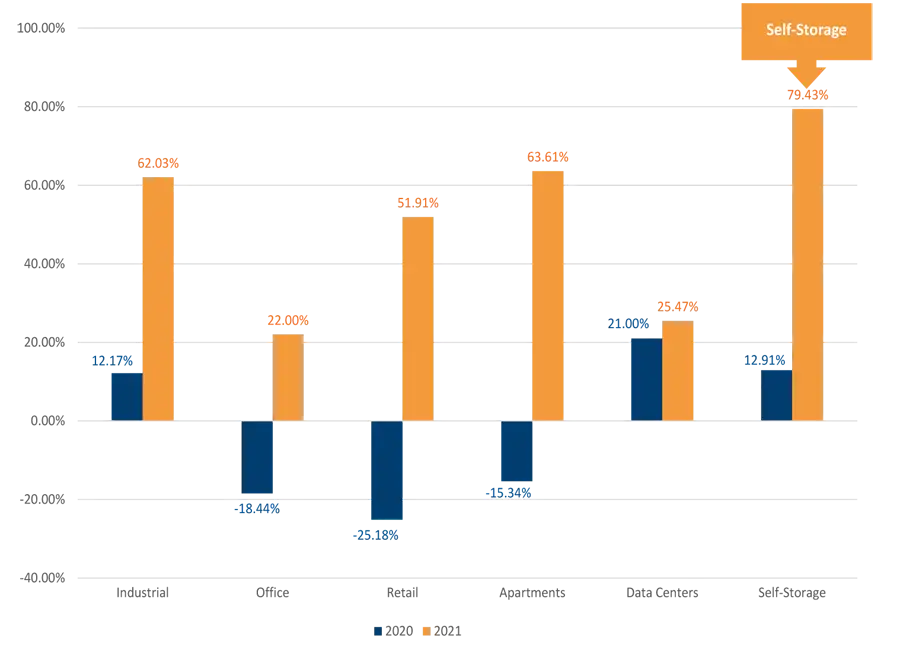
According to the NAREIT* in 2007-2009 Self Storage was down (-3.86%) versus Apartments (-6.72%), Retail (-12.32%), Office (-8.16%), and the S&P 500 (-21.10%). During 2020, the asset class outperformed all other asset classes except Data Centers. Self Storage was up 12.91% in 2020 despite the global pandemic.
Market Consolidation Opportunity
According to the 2021 Self Storage Almanac the public traded companies own less than 30% of the self storage market. There is a consolidation opportunity for Reliant to acquire facilities owned by mom-and-pop operators and generate revenue enhancements by deploying a professional management strategy.
How Has Self-Storage Performed During Economic Downturn?
Outperforming the broader REIT universe, the storage REIT index ended 2020 with total returns at 12.91% only outperformed by Data Centers at 21% (FTSE NAREIT)
The Storage REIT Index returns through 2021 are 79.43%

4 “Ds” of self-storage demand playing out during COVID-19:
Low Maintenance
- Little infrastructure to maintain
- Low utility usage leading to reduced
overhead expense
ABOUT RELIANT
Reliant Real Estate Management
- A commercial Self-Storage operator with offices in Roswell, GA founded in 2010
- 17th largest self-storage operator in 2022*
- Current portfolio of 90+ properties, 48,000+ units, and a portfolio valuation of over $1,000,000,000+ as of 2022
- Experienced leadership team with over $1,000,000,000 in Self-Storage transactions in past 3 years
Track Record
- Average gross project level returns on 38 properties sold are 33.8% IRR and 2.57 equity multiple
- Average hold time on 38 properties sold is 3.6 years
- Average project level annual ROI on equity is 48% per year
- Average NOI growth over holding period is 34%
- Average Exit Cap Rate is 5.15%
Properties
90+
Units
48,382
Invested Principal Lost
$0
Estimated Portfolio Valuation
$1.2 Bn
Net Rentable Square Feet
7,705,000
Average Project Equity Multiple
2.57x
Average Exit Cap Rate
5.15%
Average Total Return on Investment Upon Sale
157%
Average Annual Return on Investment Upon Sale
43.37%
Average Project Internal Rate of Return
33.8%
Average Investment Holding Period
3.62 yrs
Prior performance is not indicative of future results. Historical performance results presented herein were obtained during market, economic, and other conditions that may or may not be similar to that experienced by the Fund. Such results were also obtained in investments with structures, terms, and conditions that may be different than those of the Fund. It should not be assumed that investments made by the Fund will be profitable or will equal the performance of these investments.
PREVIOUS FUND PERFORMANCE

Realized Returns
32% Annual ROI | 64% Total ROI
1.64 Equity Multiple | 1.96 Year Hold Period
Returns Based on Class C investor
Self-Storage Fund I, LLC
- Launched: May 2019
- Closed: March 2020
- Projected Hold Period: 6 Years
- Projected Returns:
- 15% Annual Return
- 90% Total ROI over 6 Years
- 1.9X Equity Multiple After 6 Years
- 11 Properties Closed in Fund I Portfolio
Self-Storage Fund II, LLC
- Launched: April of 2020
- Closed: October of 2021
- Projected Hold Period: 6 Years
- Projected Returns:
- 12-15% Annual Return
- 72-90% Total ROI over 6 Years
- 1.72X-1.9X Equity Multiple After 6 Years
- 11 Properties Closed in Fund II

Current Performance
37% above NOI projections through March of 2023

Current Performance
7% above NOI projections through June of 2022
Self-Storage Fund III, LLC
- Launched: November 2021
- Closed: September 2022
- Projected Hold Period: 6 Years
- Projected Returns:
- 12-15% Annual Return
- 80% Total ROI over 6 Years
- 1.80X Equity Multiple After 6 Years
- 90 Properties Closed in Fund III Portfolio
Prior performance is not indicative of future results. Historical performance results presented herein were obtained during market, economic, and other conditions that may or may not be similar to that experienced by the Fund. Such results were also obtained in investments with structures, terms, and conditions that may be different than those of the Fund. It should not be assumed that investments made by the Fund will be profitable or will equal the performance of these investments.
PROJECTED INVESTMENT RETURNS


An investment of $100,000 is projected to return $180,000 to investor, including return of initial investment of $100,000.
LEVERS OF VALUE-ADD
Expansion of Facilities
We will build out additional square footage/units at select properties where we believe the market demand exceeds market supply of storage. Our goal is to create additional Net Operating Income (NOI) growth by getting the new units leased up to stabilization. The additional NOI will increase the value of the building all other things being equal. Additional NOI is always the goal in our value-add strategy.
Revenue Enhancements
Ancillary income opportunities including U-Haul truck rentals, tenant insurance, late fees, etc. are identified for each property and implemented by our on-site operational team. Revenue growth is a primary focus of our operational team and constantly monitored by internal audits and market studies.
GEOGRAPHIC DIVERSIFICATION

Frequently Asked Questions
All distributions (and quarterly reports) are scheduled for 30-45 days after quarter end.
Yes, we have many investors who invest using qualified funds. If you need more information on how you can utilize these funds, let us know, and we can connect you with an industry expert to facilitate a rollover.
Your 9% preferred return starts to accumulate on the day your capital is deployed in a property closing. Our funding deadlines are set based on upcoming property closings.
There are no refinancing scenarios included in our projected returns. We will evaluate the potential of refinancing the properties once we reach stabilization. If we can refinance properties and receive proceeds, we would return that to investors first by returning the 9% preferred return and then 100% of the principal, or as much as proceeds allow.
Our accounting team schedules the delivery of the K-1 statements on or around March 15th.
This is a value-add fund meaning we are investing in various ways to make significant improvements to the properties in the fund. Therefore, cash flow is projected to be modest throughout the hold period and a large portion of the projected overall return is realized through equity appreciation at the time of sale or re-finance. We project a total return of 80% based on a 6-year hold period.
We have been fortunate to have great success in the past, however, we want to make sure we maintain reasonable expectations and factor in the inherent risk of the investment. We stand by the saying, “Under promise and over deliver” and that is reflected in both our past performance and current projections.
Disclaimer
This Business Plan contains privileged and confidential information and unauthorized use of this information in any manner is strictly prohibited. If you are not the intended recipient, please notify the sender immediately. This Business Plan is for informational purposes and not intended to be a general solicitation or a securities offering of any kind. The information contained herein is from sources believed to be reliable, however no representation by Sponsor(s), either expressed or implied, is made as to the accuracy of any information on this property and all investors should conduct their own research to determine the accuracy of any statements made. An investment in this offering will be a speculative investment and subject to significant risks and therefore investors are encouraged to consult with their personal legal and tax advisors. Neither the Sponsor(s), nor their representatives, officers, employees, affiliates, sub-contractor or vendors provide tax, legal or investment advice. Nothing in this document is intended to be or should be construed as such advice.
The SEC has not passed upon the merits of or given its approval to the securities, the terms of the offering, or the accuracy or completeness of any offering materials. However, prior to making any decision to contribute capital, all investors must review and execute the Private Placement Memorandum and related offering documents. The securities are subject to legal restrictions on transfer and resale and investors should not assume they will be able to resell their securities Potential investors and other readers are also cautioned that these forward-looking statements are predictions only based on current information, assumptions and expectations that are inherently subject to risks and uncertainties that could cause future events or results to differ materially from those set forth or implied by such forward looking statements.
These forward-looking statements can be identified by the use of forward-looking terminology, such as "may," "will," "seek," "should," "expect," "anticipate," "project, "estimate," "intend," "continue," or "believe" or the negatives thereof or other variations thereon or comparable terminology. These forward-looking statements are only made as of the date of this executive summary and Sponsors undertake no obligation to publicly update such forward-looking statements to reflect subsequent events or circumstances.
Financial Disclaimer
This Business Plan further contains several future financial projections and forecasts. These estimated projections are based on numerous assumptions and hypothetical scenarios and Sponsor(s) explicitly makes no representation or warranty of any kind with respect to any financial projection or forecast delivered in connection with the Offering or any of the assumptions underlying them. This Business plan further contains performance data that represents past performances. Past performance does not guarantee future results. Current performance may be lower or higher than the performance data presented. All return examples provided are based on assumptions and expectations in light of currently available information, industry trends and comparisons to competitor's financials. Therefore, actual performance may, and most likely will, substantially differ from these projections and no guarantee is presented or implied as to the accuracy of specific forecasts, projections or predictive statements contained in this Business Plan. The Sponsor further makes no representations or warranties that any investor will, or is likely to, achieve profits similar to those shown in the pro-formas or other financial projections.


